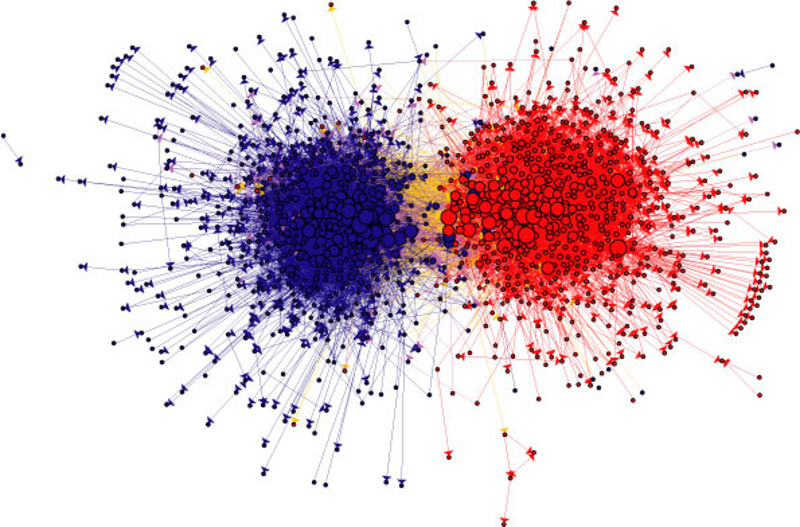
Let’s be honest, it doesn’t matter which side of the fence you sit on, we were all surprised by the outcome of the EU referendum and Trump’s election as US president. Since then, there has been plenty of dinner table and pub conversation about both outcomes and extensive economic analysis but what does it tell us about human nature and the organisations we work in.
Our everyday experience shows that we are unlikely to be in regular contact with people who are different to ourselves; we tend to like people who like what we like and value what we value. Geographically we have seen the same story, to the point that the so called ‘post code’ lottery might more accurately be called the ‘like-minded, like-educated and like-paid’ lottery?
Similarly, in our virtual worlds Amazon ensures that we are stalked by the words ‘people like you…’ in an attempt to segment us by our buying habits. Social media has a similar amplifying effect. Facebook, Twitter and LinkedIn make a virtue of connecting us to people ‘like us’. While providing content that we like, the same algorithms create virtual worlds where our values and beliefs go unchallenged, and run the risk of becoming a form of mathematically induced apartheid!
Early work on what we all now recognise as ‘groupthink’ showed that when we all agree there is a tendency to become more extreme in our views, what is known as the ‘shift to risk’. Today social media has created ‘social echo chambers’ that are the new virtual social divide in which we communicate with those who support, endorse and magnify our own world view. But is it the same in organisations and as leaders do we really know what is happening below the surface of organisational civility?
As a consultant, I share with my colleagues a dissatisfaction with how we understand organisations and the neatness of organisational charts. In reality, organisations are a constellation of informal networks that we have to manage, navigate and lead on a moment by moment basis, but help is at hand.
The emerging field of Social Network Analysis (SNA) provides an amazing way of understanding and representing this network of relationships. As Brexit and the US election illustrated, consciously or unconsciously, we tend to connect with people who resemble us. Of particular interest is how tightly interwoven our personal and professional networks can be. If you know Alan, Alan knows Michelle and Michelle knows you, the relationship is said to be transitive. High transitivity exists where individuals are deeply embedded within a single group, while low transitivity occurs among people who make contact with several groups who do not know each other. High transitivity can make for great teamwork, but poor receptiveness to new or different ideas.
At an organizational level, it is possible to make sense of social networks by mapping lines of communication, advice and trust in order to create a series of visual images, which we call ‘sociograms’. The sociograms are created by feeding the data from three simple questions into Network Visualization Software, which creates a 2D picture of the network of, with nodes (people) and ties (connections between them), and placing those who are more connected in the centre and those who are less connected at the periphery.
- Communication networks reveal who talks to whom on a regular basis. Mapping communication networks can help identify gaps in information flow or inefficient use of resources.
- Advice networks show the influential members in an organization who others depend on to solve problems or provide technical information. Because these networks show influential players in the day-to-day operations of a company, they are useful to examine when an organisation is considering routine changes.
- Trust or support network shows the individuals we are most likely to share our thoughts, feelings and organizational intelligence with. Mapping trust networks can uncover both change blockers and change advocates.
Social network analysis not only facilitates the exchange of accurate information, about who has what, who needs what and who can do what, it also enables the exchange of ideas that can feed innovation. For example, identifying where dense network connections (high transitivity) may be stifling the spread of new ideas or where connections to other teams and departments are sparse or non-existent.
Sociograms provide a map that graphically depicts how relationships inside an organization really work. They can help to visualize and understand these flows of communication, advice and trust, showing where an organization is resilient and strong, where it is vulnerable and weak, and how the real network can help plan strategies for organizational change.
Brexit and the Trump election victory have already changed the UK and the US and their relationship with the world in unimagined ways. These unplanned disruptive changes came about, not solely as a result of poor political judgement, but because we individually failed to cross the social divide economically and educationally. Critically we sought advice from people who were most likely to vote like ourselves rather than those with a different view.
Similar dangers lurk in organisations and leaders need to make more effort to understand and work with the invisible ‘social network’ to understand why information reaches some employees, but not others; why we struggle to generate new ideas; and why we fail to implement change.


